How to See Rowcounts and Execution Time for In-Flight Queries in SQL Server
I frequently need to see rowcounts and execution time for queries while they’re running. Maybe I’m troubleshooting a slow query …
Read MoreBy Kendra Little on • 7 min read
Identifying that a query plan has been bossed around in Query Store can be a bit tricky, because it can appear in different ways.
This is a long post, but there is a recap at the bottom if you’re short on time. Or just vote up my suggestion to make this easier to see: vote here.
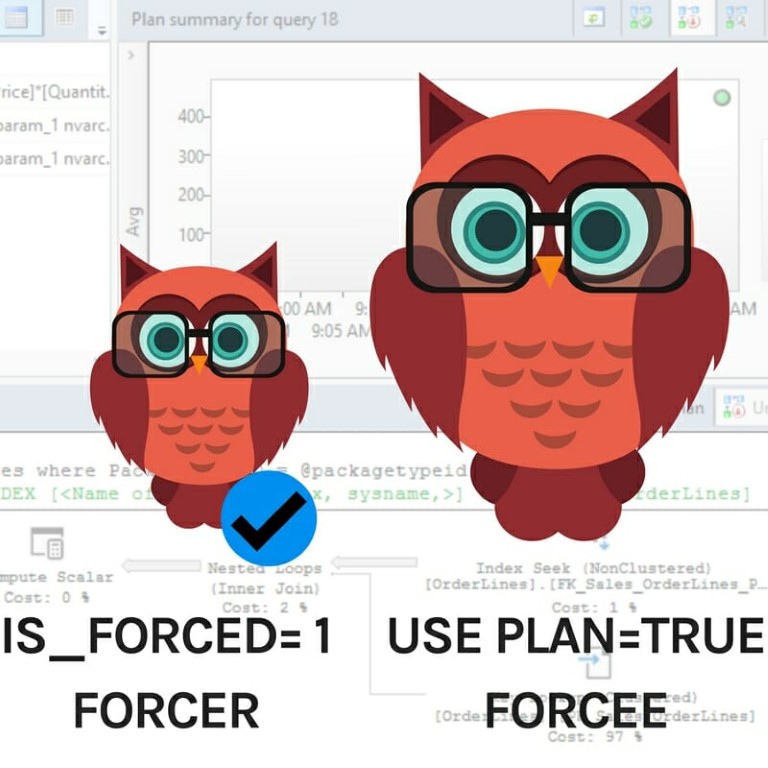
This type of forced plan will have a check mark in its bubble on the graphical Query Store reports, and also have is_forced = 1 in sys.query_store_plan.
However, this type of forced plan will NOT have “Use plan” = true in the properties of the top leftmost operator.
This type of forced plan with NOT have a check mark on in its bubble on the Query Store reports, and will NOT have is_forced = 1 in sys.query_store plan.
But it WILL have “Use plan” = true in the properties of the top leftmost operator.
Whether or not you have the 2017 Automatic Plan Correction feature enabled (part of Auto-Tuning), you’re clicking the graphical “Force Plan” button in the Query Store reports, or you’re running sys.sp_query_store_force_plan, you will see these differences.
In this post, I’m going to show you how this works if I manually run sys.sp_query_store_force_plan. The demo code is at the bottom of the post and also supports letting Automatic Plan Correction force the plan, so you can run it either way and play with it for yourself.
Thanks to Jovan Popovic of Microsoft for publishing the original code under the MIT license. I adapted his code for this demo.
I’m using manual plan forcing in Query Store for this demo, so first up I:
Then I start a workload. I have changed the demo slightly from Jovan’s original, and in our version we run a
EXEC sp_executesql N'select avg([UnitPrice]*[Quantity])
            from Sales.OrderLines
            where PackageTypeID = @packagetypeid', N'@packagetypeid int',
          @packagetypeid = 5;
GO 60
We run this query 60 times.
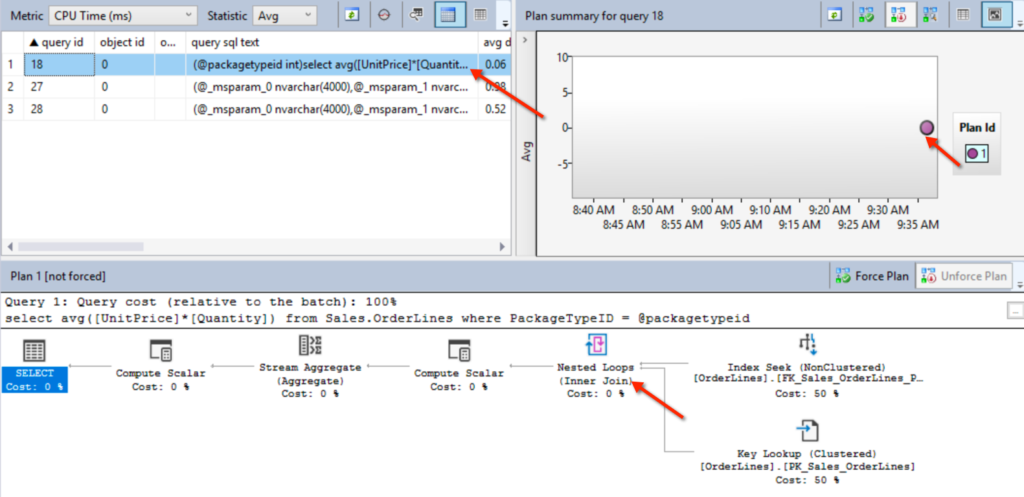
This gets a nested loop plan in cache for our query with an average CPU time of .06 milliseconds. Here’s what it looks like in the Top Resource Consumers Report:
Lots of things can cause a recompile: memory pressure, data in the tables changing, or someone running ALTER DATABASE SCOPED CONFIGURATION CLEAR PROCEDURE_CACHE.
In this case, it’s the third one.
ALTER DATABASE SCOPED CONFIGURATION CLEAR PROCEDURE_CACHE;
GO

/* Get slow plan in cache */
EXEC sp_executesql N'select avg([UnitPrice]*[Quantity])
            from Sales.OrderLines
            where PackageTypeID = @packagetypeid', N'@packagetypeid int',
          @packagetypeid = 0;
GO
The query that happens to compile now for our query has @packagetypeid = 0.
This query doesn’t get a nested loop join, it gets a hash match join. It doesn’t take too long to run by itself, but unfortunately this plan is slow as dirt when it is reused for a value like @packagetypeid = 7.
That runs 20 times, and this plan has an average CPU time of 389 seconds.
EXEC sp_executesql N'select avg([UnitPrice]*[Quantity])
            from Sales.OrderLines
            where PackageTypeID = @packagetypeid', N'@packagetypeid int', @packagetypeid = 7;
GO 20
Because I’m on SQL Server 2017 and I have Query Store configured, sys.dm_db_tuning_recommendations has a little heads-up for me, if I know to look there.
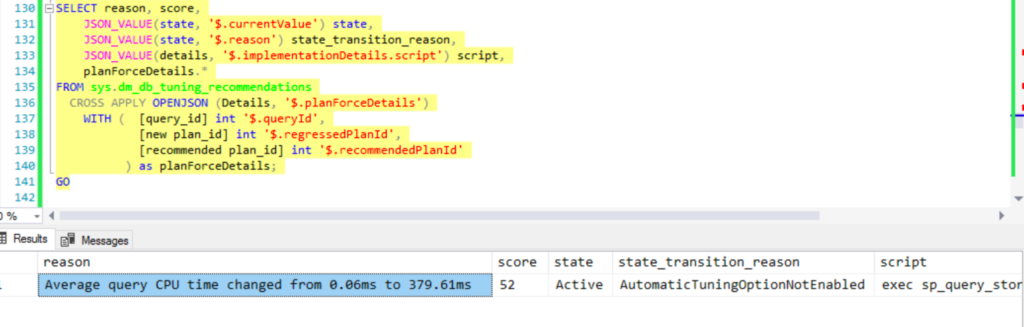
It looks like I’ve got a plan re-use problem, aka ‘Bad Parameter Sniffing’.
If I were to do the right thing, I would try to figure out how to stabilize the plans without forcing anything.
But this post isn’t about doing the right thing, it’s about forcing!
exec sys.sp_query_store_force_plan @query_id = 18, @plan_id = 1
GO
I have now forced plan_id 1!
If I look at Top Resource Consumers, plan_id 1 now has a check mark by it:
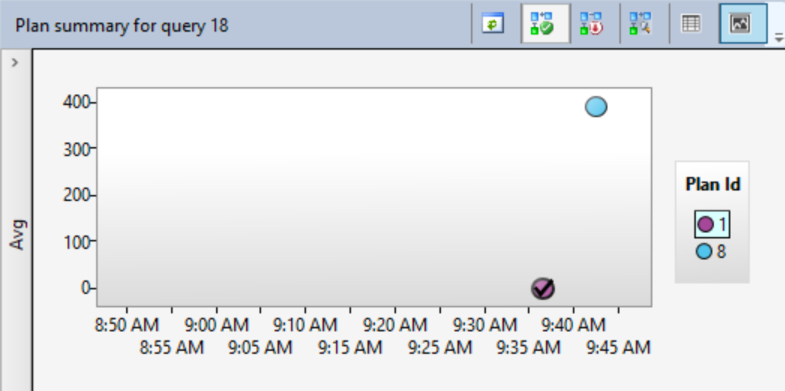
Our query just runs once, again with @packagetypeid = 7.
This is the first time the query has run with @packagetypeid = 7 while being forced to use a plan compiled for @packagetypeid=7.
EXEC sp_executesql N'select avg([UnitPrice]*[Quantity])
            from Sales.OrderLines
            where PackageTypeID = @packagetypeid', N'@packagetypeid int', @packagetypeid = 7;
GO
Our query uses the forced plan, but, wow, it gets a new plan_id: 10. Here’s what plan_id 10 looks like with its plan:
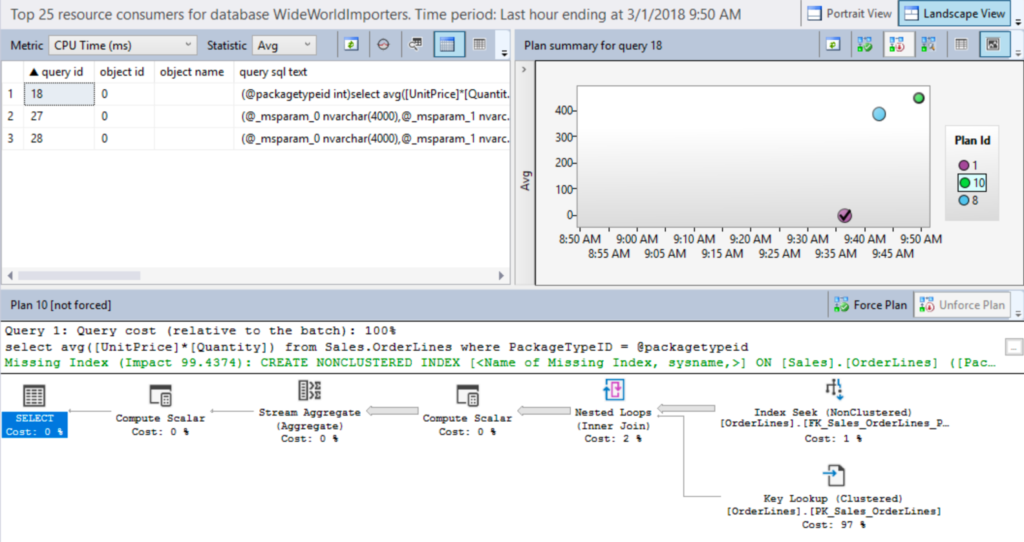
Plan_id 10 has no check-mark, but it has been forced to use the nested loop plan shape.
However, notice that it got a missing index request, and the bars in the plan are much thicker than the nested loop plan in the screenshot above.
If we look in the properties of the SELECT operator on plan_id 10, I can see a couple of things:
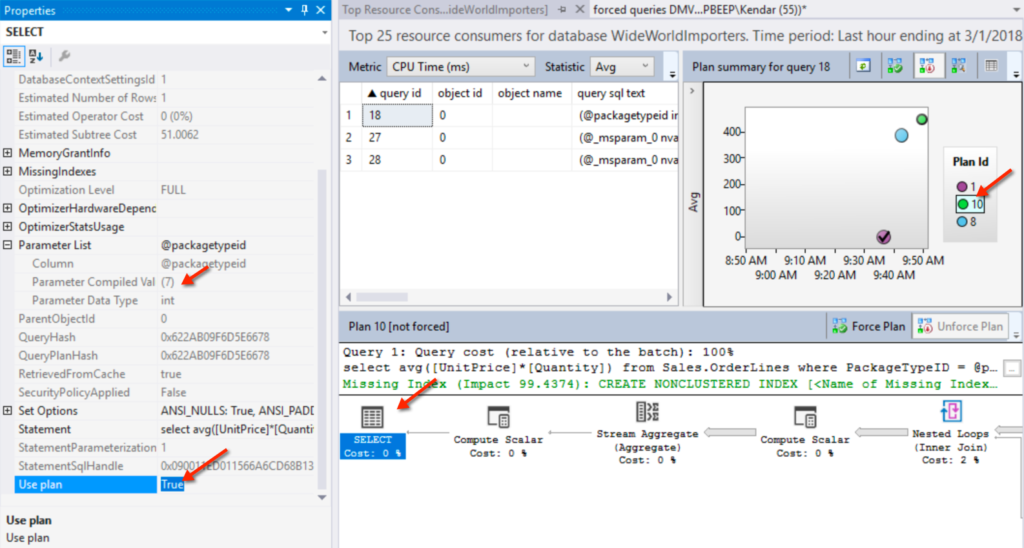
In the Parameter List, @packagetypeid = 7. That is the value this was compiled for. That influenced the costing. That’s good, because there WERE more rows flowing into that stream aggregate. The higher estimates are also responsible for the green hint notifying us that we should take a look at our indexes, because it could be better.
This plan was generated with a directive to use this plan shape. It didn’t just happen.
Look right above the SELECT operator in the plan. It says “not forced”.
But, uh….. Use plan = true.
If it wasn’t forced, it was leaned on pretty heavily!
I read that “not forced” as, “This is the exact plan that was forced.” To know if it was forced but has different costs, you have to look for that use_plan=true.

The checkmark in the graphic Query Store reports is reflecting the plan which has is_forced_plan = 1.
For plan_id 10, if you dig into the plan stored in the query_plan column in the DMV, you will find that “Use plan=true” property, just like we saw in the report.
This isn’t easy to summarize, but I’m going to give it my best shot!
When plans are forced in Query Store, whether it’s done by a user or by Automatic Tuning, there is more than one type of “forced” plan.
Plan FORCER: The exact plan which is forced will show with a check mark in Query Store reports, and will have Is_Forced = 1 in sys.query_store_plan.
Sometimes (probably often), you will see Slightly Different Plan FORCEEs: Once a plan is forced, either
I totally made up the words “FORCER” and “Slightly Different Plan FORCEE”, for the lack of better terms. And they make me laugh.
Here’s the demo code in a gist.
Vote up my suggestion to make this easier to see: vote here.


Copyright (c) 2025, Catalyze SQL, LLC; all rights reserved. Opinions expressed on this site are solely those of Kendra Little of Catalyze SQL, LLC. Content policy: Short excerpts of blog posts (3 sentences) may be republished, but longer excerpts and artwork cannot be shared without explicit permission.