How to See Rowcounts and Execution Time for In-Flight Queries in SQL Server
I frequently need to see rowcounts and execution time for queries while they’re running. Maybe I’m troubleshooting a slow query …
Read Moreon • 4 min read
I received a question recently asking about disk access patterns for index seeks in SQL Server. The question suggested that index seeks would have a random read pattern.
Is this necessarily the case?

We tend to think of an index seek as a small, efficient retrieval of a few pages. It “seeks” straight there.
But this isn’t necessarily the case. Seeks can read quite a large amount of data – even all the data in a table if it meets the criteria for the key that I’m seeking on.
Seeks may also be more complex than they sound: they may seek on one key of the index, and then use non-seekable predicates to check every row that comes back to apply more filters.
I have a table named dbo.FirstNameByBirthDate, which has a row for each baby name reported in the United States from 1880 to 2015.
There is a nonclustered index on a column named BirthYear.
I run the following query:
SELECT COUNT(*)
FROM dbo.FirstNameByBirthDate
WHERE BirthYear > cast(1700 as int);
GO
Here’s the plan for the query. This gets a seek operator…

Digging into the properties of that operator, the seek predicate here is:
Seek Keys[1]: Start: [BabbyNames201711].[dbo].[FirstNameByBirthDate].BirthYear > Scalar Operator([@1])
SQL Server knows this is going to be a lot of rows. It decides to go parallel.
Having checked the data, I know that this seek operation is going to read the entire index on BirthYear. But, technically, this is still a seek operation.
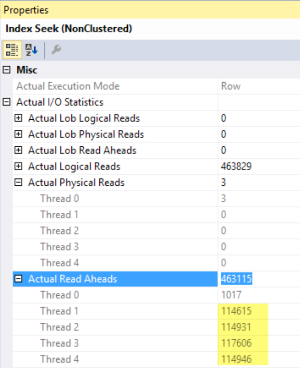
Looking at an actual execution plan, I dig into the index seek operator and it shows me information about the physical IO. Almost all of the requests were read-ahead reads.
Read-ahead is a mechanism that SQL Server can use when it’s pulling a lot of information from disk. Instead of pulling 8K pages onesy-twosy-threesy, SQL Server can suck up big chunks of pages from disk with a vacuum cleaner.
If you’re running developer or enterprise edition, you may get a larger vacuum cleaner.
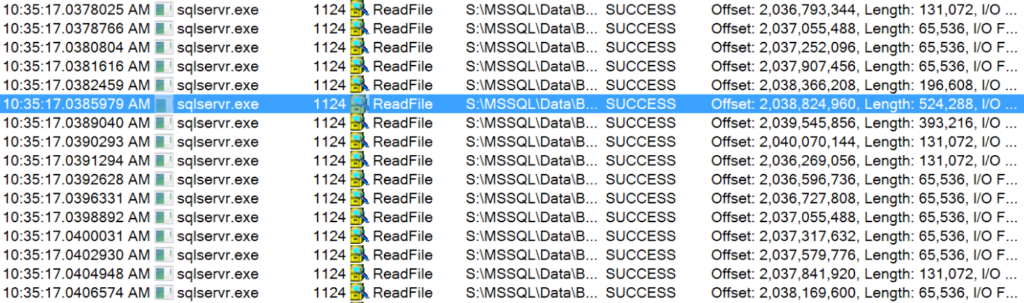
There’s a couple of ways to look at the read size. One method is to fire up the SysInternals tool Process Monitor and watch ReadFile operations from sqlservr.exe on a test system.
Here’s a sample of the reads it saw when I was doing this seek (and not running anything else on the instance). The highlighted row has a length of 524,288 - that’s a 512KB read! I’m running Developer Edition, so I’ve got the big read-ahead vacuum cleaner.
Most of the reads here are 64K chunks, but there’s quite a few cases when it can grab more…
This means that there’s no simple shortcut to establishing and testing IO patterns for an application.
You shouldn’t, for instance, look at a performance counter that says there’s a lot of index seeks and interpret that to mean that there’s a lot of tiny 8K random read operations going to disk. Index seeks just aren’t that simple, and that’s a good thing for performance! Even if seeks do need to go to disk, they are able to leverage read-ahead reads – and they may be ‘seeking’ a lot of data.
If you want to get into the nitty gritty and collect data to help you characterize your workload, check out the Analyzing I/O Characteristics and Sizing Storage Systems for SQL Server whitepaper.
And I guess I should admit: read-ahead doesn’t really use a vacuum cleaner.


Copyright (c) 2025, Catalyze SQL, LLC; all rights reserved. Opinions expressed on this site are solely those of Kendra Little of Catalyze SQL, LLC. Content policy: Short excerpts of blog posts (3 sentences) may be republished, but longer excerpts and artwork cannot be shared without explicit permission.