Why Won't PostgreSQL Use My Covering Index?
Dear Postgres, Why won’t you use my covering index?
Lately I’ve been learning to tune queries running against PostgreSQL, and it’s …
Read Moreon • 4 min read
I’m sometimes asked if the number of CPU cores used by a query determines the number of tempdb files that the query can use.
Good news: even a single threaded query can use multiple tempdb data files.

My first version of this post used a flawed methodology: I configured an instance of SQL Server 2016 with four equally sized, small tempdb files. I then tested a set of queries that qualify for parallelism alternately using 4 processors, and running them single threaded (using option maxdop 1 as a query hint).
I observed that the queries always made all four files grow.
However, in that first version of the post, I forgot that the default behavior in SQL Server 2016 is to grow all files in tempdb simultaneously when one grows. Basically, one small feature of SQL Server 2016 is that trace flag 1117 is always enabled by default for tempdb. Just because all the data files grew doesn’t mean they all got used!
(For more on tempdb behavior changes in SQL Server 2016, read Aaron Bertrand’s post here.)
For most databases, you can control whether all the files in a filegroup grow at once by changing a setting on the filegroup.
But not tempdb. If you run this command:
ALTER DATABASE tempdb MODIFY FILEGROUP [PRIMARY] AUTOGROW_SINGLE_FILE;
GO
You get the error:
Msg 5058, Level 16, State 12, Line 1 Option ‘AUTOGROW_SINGLE_FILE’ cannot be set in database ’tempdb’.
I admit: I didn’t do this in the first place because it was a bunch of work. The devil is in the detail with stuff like this. A lot of events seem like they’d work, but then you try to use them and either you don’t get the data you’d expect, or the trace generates such a massive amount of data that it’s hard to work with.
I love the histogram target because it doesn’t generate a huge file of data to confuse myself with. I set up my new test this way…
Extended Events trace for sql server.file_read
I set up a bunch of queries in a batch, and for each query:
I ran the whole thing a couple of times to make sure I got consistent results. And I did!
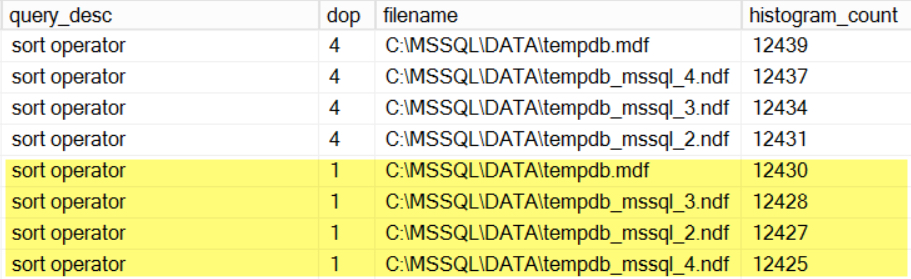
One of my queries does a large sort operation. Using maxdop 4 and maxdop 1, it still evenly used my tempdb data files.
I saw similar patterns with a query using a merge join, a query using a lazy spool, and a query with a sort that was engineered to be under-estimated (and has a memory spill).
As you might guess, things may not always get evenly accessed, even if you have evenly sized tempdb files. One of my queries did a select into a temp table. Although it used all four tempdb files whether or not it went parallel, there were more file_read events against the first tempdb file than against the other four.

It’s possible. I haven’t used the sqlserver.file_read event much, or tested it super thoroughly. It seemed to give me consistent results.
So while it’s possible that I’ll suddenly realize that there’s a better way to measure this, I think at least my results are better than they were the first time I wrote this post!


Copyright (c) 2025, Catalyze SQL, LLC; all rights reserved. Opinions expressed on this site are solely those of Kendra Little of Catalyze SQL, LLC. Content policy: Short excerpts of blog posts (3 sentences) may be republished, but longer excerpts and artwork cannot be shared without explicit permission.