
How to See Rowcounts and Execution Time for In-Flight Queries in SQL Server
I frequently need to see rowcounts and execution time for queries while they’re running. Maybe I’m troubleshooting a slow query …
Read Moreon • 1 min read
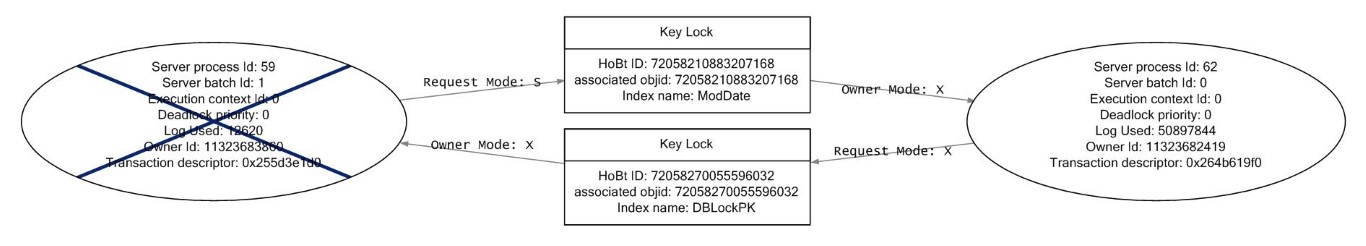
Until recently I’d never used the deadlock graph event in Profiler. I’ve been pretty lucky and haven’t had to troubleshoot deadlocks much until now. The deadlock graph turns out to be quite nice!
When you add this event, it uses the TextData column to describe the deadlock in XML. You can copy the contents and parse them, or just read through it to see details on the transactions involved in the deadlock. Profiler also displays a graphical picture of the deadlock. I find the picture is helpful mostly when going through the XML itself, but the whole thing is pretty great.
The XML itself looks to be about the same as you get from trace flag 1222 in the SQL log, but you get the picture and the context of the other events you are profiling in sequence as well.
Here is a sample look at how profiler displayed one of our deadlocks:


Copyright (c) 2025, Catalyze SQL, LLC; all rights reserved. Opinions expressed on this site are solely those of Kendra Little of Catalyze SQL, LLC. Content policy: Short excerpts of blog posts (3 sentences) may be republished, but longer excerpts and artwork cannot be shared without explicit permission.